LLM observability is the practice of tracking how an AI application behaves in production, by collecting real time metrics related to what it receives, which operations it performs, what it returns, and how much time and money each request consumes. The practice of LLM observability helps engineering teams detect quality problems, investigate failures, and improve reliability to levels better than achievable via conventional application monitoring.
Different technology companies and organizations emphasise different aspects when they define LLM observability.
Together, all these definitions point to attempts to find enough data for engineers to be able to answer two questions: How did the system run? And did it do the right thing?
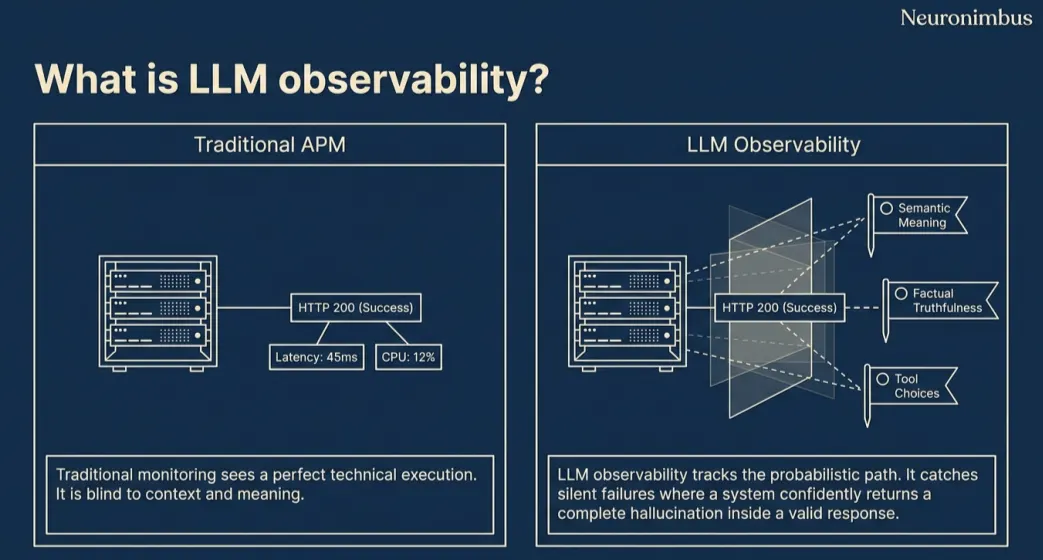
So I define LLM observability as the ability to reconstruct an AI application's execution, measure the quality and cost of its outcomes, and identify what needs to change when performance deteriorates.
To a great extent, these are exactly the goals you would associate with a conventional application performance monitoring (APM) effort. However, APM can’t answer the two questions I highlighted earlier.
Let’s consider an example.
Imagine a support assistant answering a question about refunds. The API could return HTTP 200 in two seconds. Your APM dashboard might still look healthy. But the assistant quotes from an outdated 30-day refund policy when the current policy is 14 days.
On an operational level, the request will be considered as successfully served. For the customer and the business, it failed.
That is why LLM monitoring, tracing, and evaluation belong together. With monitoring you can identify trends, with tracing you can reconstruct requests, and with evaluation you can test the quality of outputs.
The next question is which signals are worth collecting.
A dashboard of average latency and monthly token spend could look smart, but such a dashboard would miss important failures. So I would group production signals (that are relevant for LLM observability) into three categories.
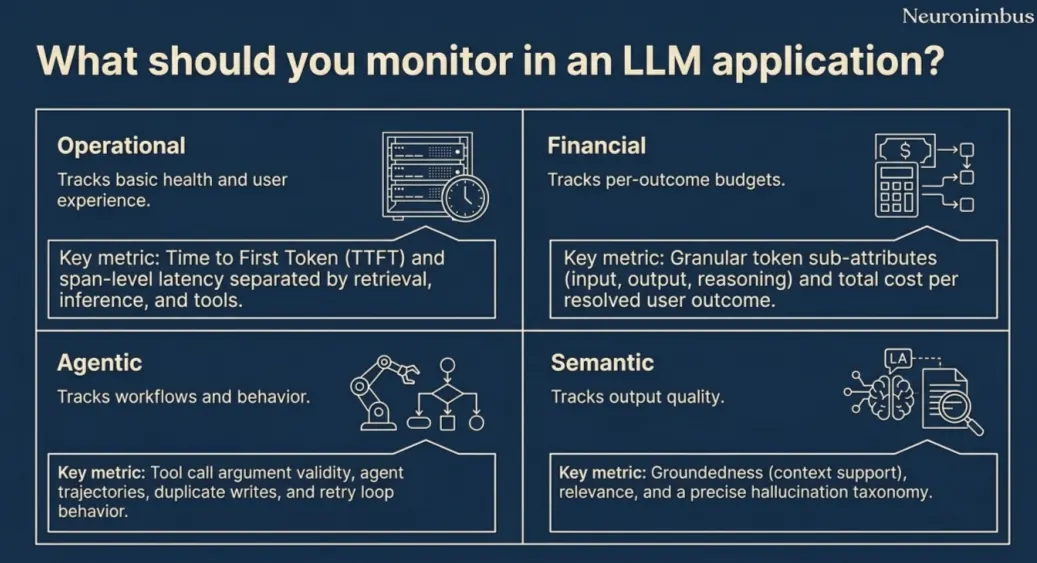
You should start with familiar operational measures and apply them to each stage of the LLM application’s workflow. Such signal will include:
Here the question changes from ‘Did the system respond?’ to ‘Can you trust what it said or did?’
The measures depend on the use case, and here are some examples:
These measures are not interchangeable. As an example, an answer can be well grounded in an outdated document and still be factually wrong. Equally, an answer may be correct but be unsupported by the material the application was authorised to use.
This is why LLM hallucination detection should be tied to a particular task and evidence source, not treated as one universal score. In document assistants, invented citations matter. In action-taking agents, an unauthorized tool call may be more serious.
To monitor an LLM’s cost, you need more detail than the provider's monthly invoice.
Once these metrics reveal an anomaly, you need a way to follow the request that produced it.
LLM tracing records the steps taken to complete one AI request and connects them into a single execution history.
The complete history is a trace. Each individual operation, such as searching a vector database or calling a model, is a span. Spans have timing information and parent-child relationships, so you can see which operation called another and where time was spent.
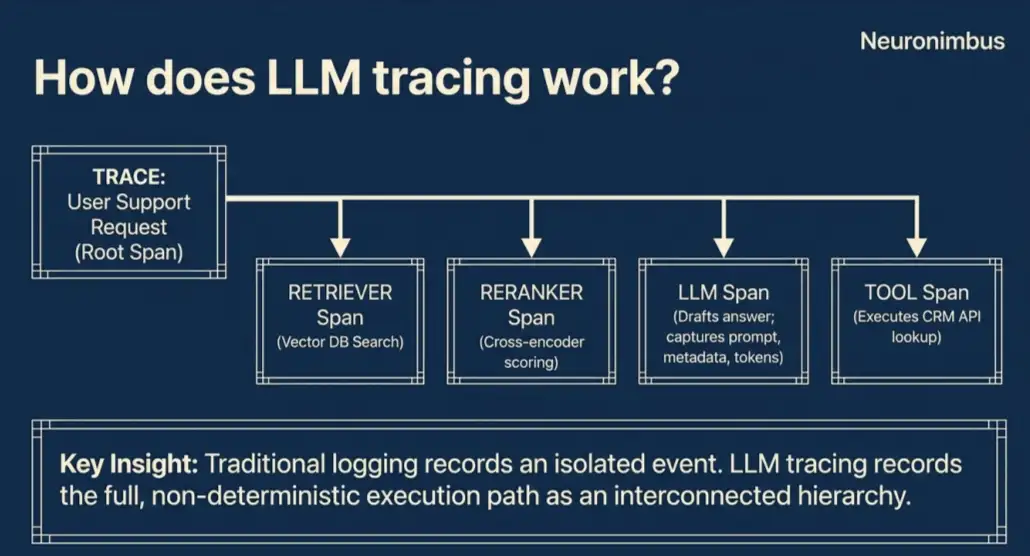
Take a customer-support assistant. Its trace might look like this:
Trace: customer asks about an order
You could set your LLM observability system to record the duration, status, and relevant metadata for each step.
A model span records the model and prompt version, token usage and, if permitted, the input and output text. A tool span records the action, arguments, and result of the tool call.
If a response takes 12 seconds, the trace may show the CRM lookup took eight seconds. The delay is in the CRM integration, not the model; investigate it before switching models or changing prompts.
This is where OpenTelemetry helps. It links AI traces to other application services, letting teams follow a request across them. Its generative AI semantic conventions define shared fields for model calls and token usage. Support differs by library, and conventions evolve, so check which fields your instrumentation captures before relying on them.
Tracing is particularly useful for agents with multi-step workflows. An agent might call the wrong tool, repeat a lookup, or ignore a failed call. The trace shows the sequence and results, helping engineers locate where the workflow went wrong.
Tracing shows how a request ran, but not whether its final answer was accurate or useful. A separate evaluation checks that.
In LLM evaluation, application outputs are evaluated on criteria defined for the job the system is supposed to do. In an LLM application, the same correct answer can be expressed in very different phrasing, so exact text matching is not sufficient on its own for evaluation of correctness.

Before releasing a new prompt, model, or retrieval configuration, run it against a representative set of cases. Include routine requests, difficult edge cases, and failure cases already cataloged from production.
Some checks are deterministic: a JSON response either matches its schema or does not. Others need a verified reference answer or a reviewer who can judge the meaning and accuracy of the answer.
Unfortunately, offline tests cannot anticipate every real customer request. Therefore, for LLM evaluation in production, you will need to add a process to review a sample of live outputs, with appropriate controls for personal and confidential information.
A second model, called an LLM-as-a-judge, can be used to score relevance, groundedness, or policy adherence using a defined rubric. Human reviewers should still examine uncertain, high-impact, and disputed cases.
First, let’s understand what LLM quality regression means. A quality regression is a decline following a change, even if every API request still succeeds.
Consider the same support assistant example, after a knowledge-base update:
When LLM evaluation and LLM tracing are connected, teams can move from a falling quality score to the specific request, documents, model version, or tool call that explains it. That is how LLM observability becomes a practical engineering capability.
Once you know which failures you need to detect, tool selection becomes easier. I would start with your application's architecture, before even thinking of a product.
Most LLM observability tools combine some form of LLM tracing, dashboards, and LLM evaluation. They differ in how deeply they support those capabilities, what they integrate with, and where your telemetry is stored.
Here is how the common options line up.
The short version of how to choose:
The next task is to turn whichever tooling you choose into a useful production process.
The mistake I see most often is teams trying to instrument everything at once and stalling. LLM observability rewards a staged rollout.
Before any code, decide what “good” and “expensive” mean for your app. A support bot cares about groundedness; a coding assistant cares about tool correctness. Pick the handful of signals you will actually act on, and ignore the rest for now.
Connect your application to an LLM tracing system using an SDK or OpenTelemetry-based instrumentation.
Record the model invocation and the operations around it: retrieval, reranking, tool calls, retries, and any fallback path.
Preserve the relationships between spans. If a request passes through an API service, an agent service, and a database, the engineer investigating it should be able to follow the same request across those boundaries.
A trace is only as useful as what is tagged on it. Stamp every trace with user, tenant, prompt version, model, and environment. Capture all the token sub-attributes, including reasoning tokens, and compute cost per span at ingest.
But prompts, retrieved documents, and outputs may contain confidential information.
Decide what can be stored, what must be redacted, who can inspect it, and how long traces are retained. Logging everything by default is not a sound enterprise policy.
Run offline tests against known cases before releases. Use deterministic validators where possible and sampled semantic LLM evaluation for qualities such as relevance and groundedness.
Connect evaluation scores to trace identifiers so a falling score leads to actual examples.
Segment dashboards by task, model, prompt version, and customer cohort. Otherwise, strong results from simple questions may conceal failures in difficult ones.
The whole system, once running, looks like this:
PROD TRAFFIC ──> TRACE CAPTURE ──> AUTO EVALS ──> FLAG FAILURES
▲ │
│ ▼
DEPLOY NEW PROMPT <── CI REGRESSION SUITE <── GOLDEN TEST SET
That loop running continuously is the difference between an app you hope is working and one you can prove is working. But a loop that only runs on deployments still leaves a gap: what happens at 3am when something breaks in live traffic? That is what alerting is for.
An alert should lead to a decision, not merely announce that a number changed.
Useful LLM monitoring alerts include:
Do not assume that one groundedness threshold works across every application. Evaluate scores against an established baseline, inspect sample sizes, and treat high-severity safety events separately from noisy quality trends.

Suppose a document-processing agent begins retrying the same validation step.
Each retry sends the document back to a model, so token usage grows even though the user never receives a completed result.
When an alert does fire, the response is four moves, in order:
Notice that this leans on everything built earlier: the traces let you triage, the test set lets you prevent. The pieces are meant to work as one system, and that is really the whole point.
A production LLM application needs more than conventional uptime monitoring. You need to know whether requests are completing, where time and money are going, and whether the answers or actions are meeting their intended requirements.
That requires LLM monitoring, tracing, and evaluation working together, with engineering teams able to act on what they find.
At Neuronimbus, we see this as part of building dependable AI systems. The goal of our industry AI solutions work is to make AI applications useful under real operating conditions, where quality, cost, security, and reliability all matter.
If you’re preparing an AI application for production and want to work through the right mix of tracing, evaluation, cost controls, and safeguards for your use case, let’s talk.
APM tracks application and infrastructure behaviour, including errors, availability, and latency. LLM observability adds visibility into prompts, retrieval, tool decisions, and output quality, which allows teams to investigate failures that occur even when the application returns a successful response.
LLM hallucination detection combines checks against retrieved evidence, automated evaluations, and human review of sampled or high-risk outputs. It cannot guarantee that every statement is true, particularly when the reference material is incomplete or outdated.
Costs depend on trace volume, storage and retention, platform pricing, and whether evaluations invoke additional models. Include instrumentation and review effort in your estimate; targeted sampling and selective payload capture can reduce unnecessary expense.
Yes, at an appropriate scale. Even a small production assistant benefits from basic LLM monitoring of errors, latency, spending, and representative answer quality; a complex enterprise platform is not automatically necessary.
Yes. OpenTelemetry supports distributed tracing and provides generative AI semantic conventions for recording model-related operations and usage. You may still need framework-specific instrumentation and an evaluation platform to assess the meaning and quality of responses.

Let Neuronimbus chart your course to a higher growth trajectory. Drop us a line, we'll get the conversation started.


Call Us

Schedule a Call


Your Next Big Idea or Transforming Your Brand Digitally
Let's talk about how we can make it happen.